| Anchor |
|---|
| Results View Graphs |
|---|
| Results View Graphs |
|---|
|
SHARING DASHBOARDS JUST GOT EASIER! ... Hint: It's just like sharing a dataview!As part of your dataset, you can now manage the order in which your text values display in tables and charts. - Click the big, new SHARE button
- Enter the people you want to share the dataview with (emails)
- Enter a message to appear in the email they receive
- Share! That’s it. You’ve now shared a dashboard with as many people you want to!
- Notice the allow recipients to make changes to the dashboard box. Click that if you want people to be able to change the dashboard. Leave it uncheck if they can only view what you give them (and you are the only one allowed to change the gadgets on the dashboard).
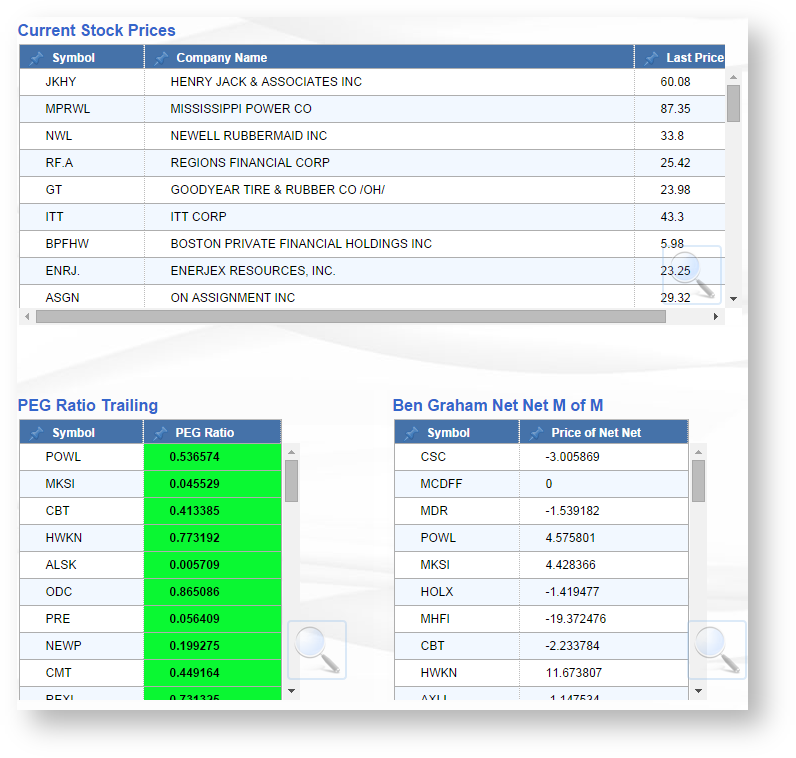
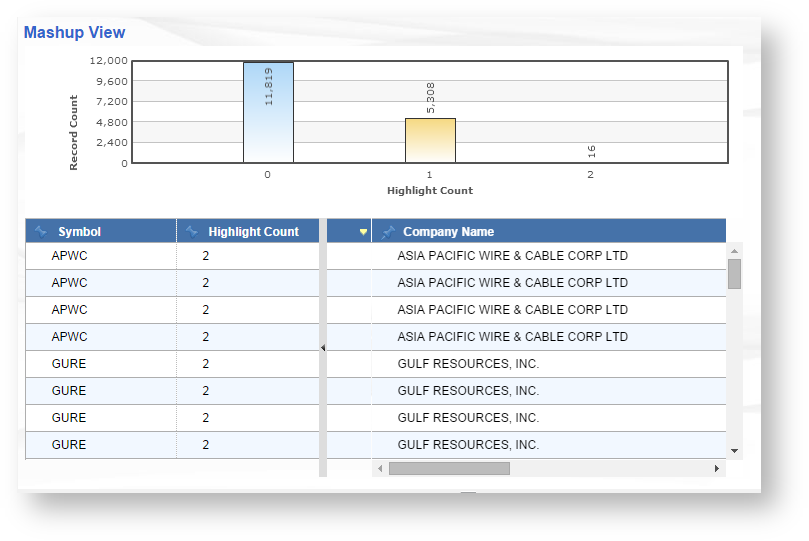
 Image Removed Image RemovedEmbed Charts Into Results ViewsUsers may now enhance they numeric fields in a results view by selecting the 'Graph it" icon. 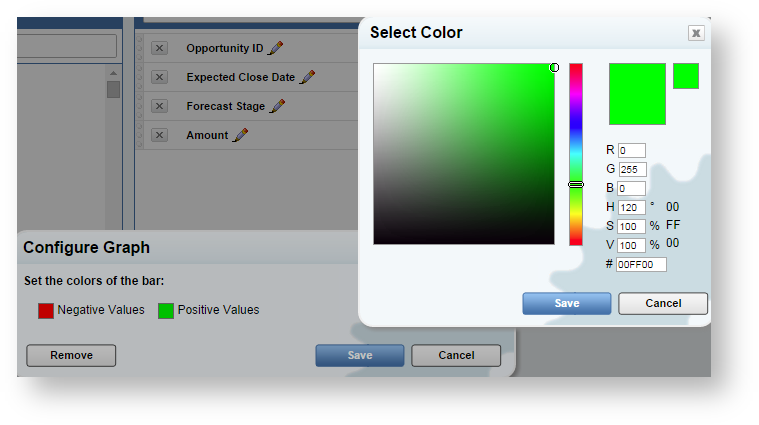 Image Added Image Added
Negative value and Positive value colors can be selected to indicate positive and negative trends 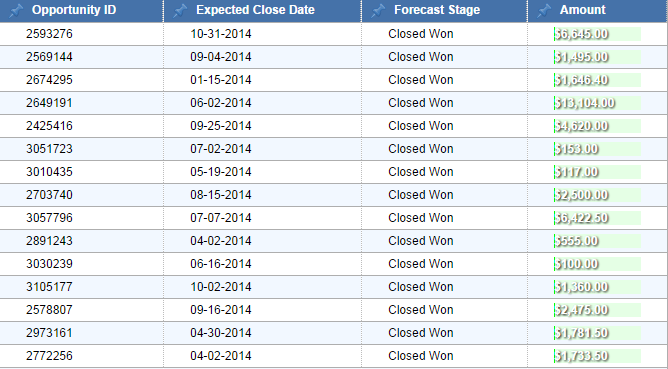 Image Added Image Added
|