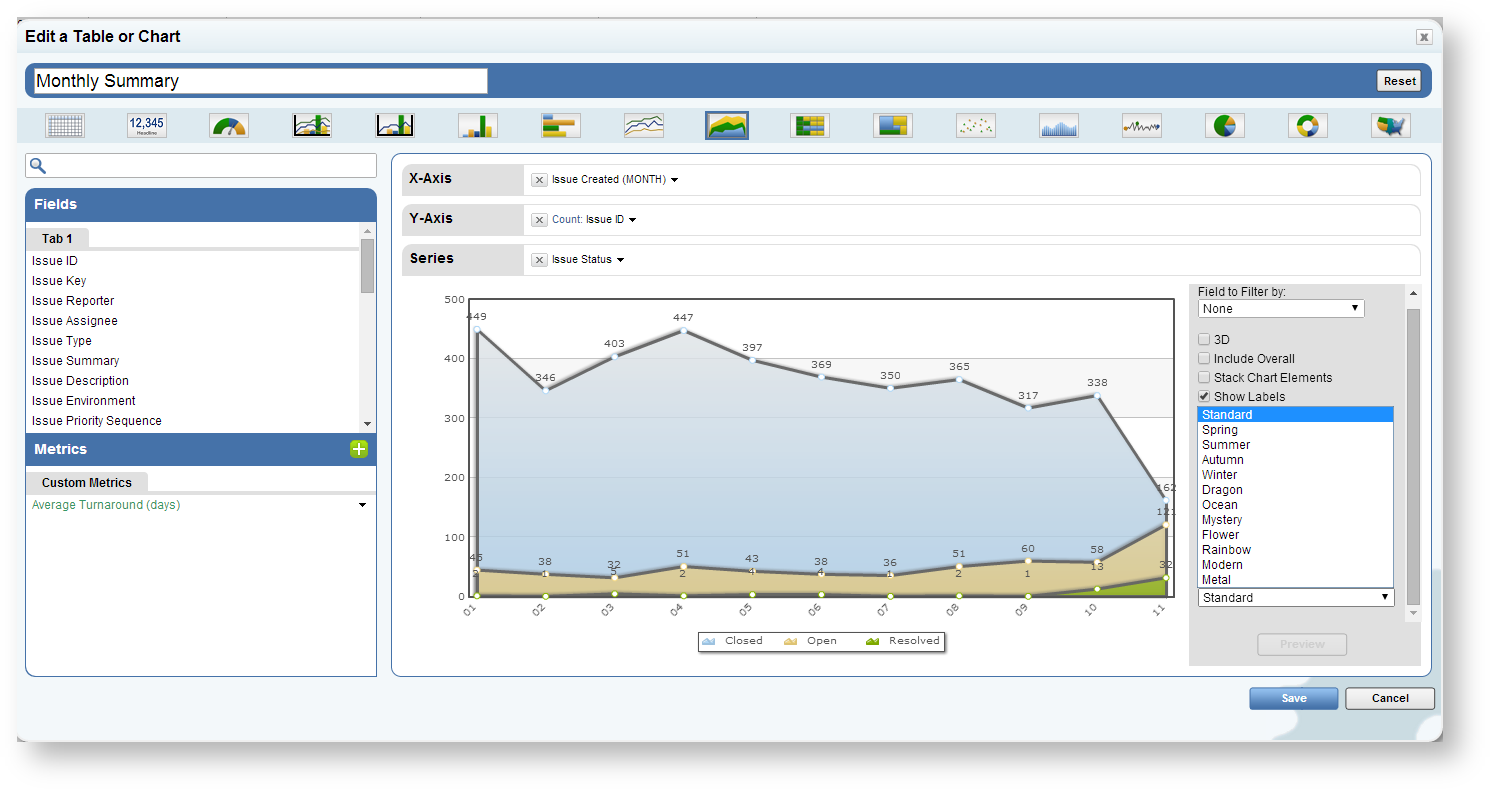
SHARING DASHBOARDS JUST GOT EASIER! ... Hint: It's just like sharing a dataview!New Dashboard Chart AssociationsAs part of your dataset, you can now manage the order in which your text values display in tables and charts. - Click the big, new SHARE button
- Enter the people you want to share the dataview with (emails)
- Enter a message to appear in the email they receive
- Share! That’s it. You’ve now shared a dashboard with as many people you want to!
- Notice the allow recipients to make changes to the dashboard box. Click that if you want people to be able to change the dashboard. Leave it uncheck if they can only view what you give them (and you are the only one allowed to change the gadgets on the dashboard).
 Image Removeda dashboard a user may choose to use a specific chart as an in place "filter", allowing users to toggle selections and change the results of other charts within the dashboard Image Removeda dashboard a user may choose to use a specific chart as an in place "filter", allowing users to toggle selections and change the results of other charts within the dashboard
- Click the down arrow on the chart you would like to make a "filter"
- Access the menu called "Change Interaction Mode", and select "Filter Current Dashboard"
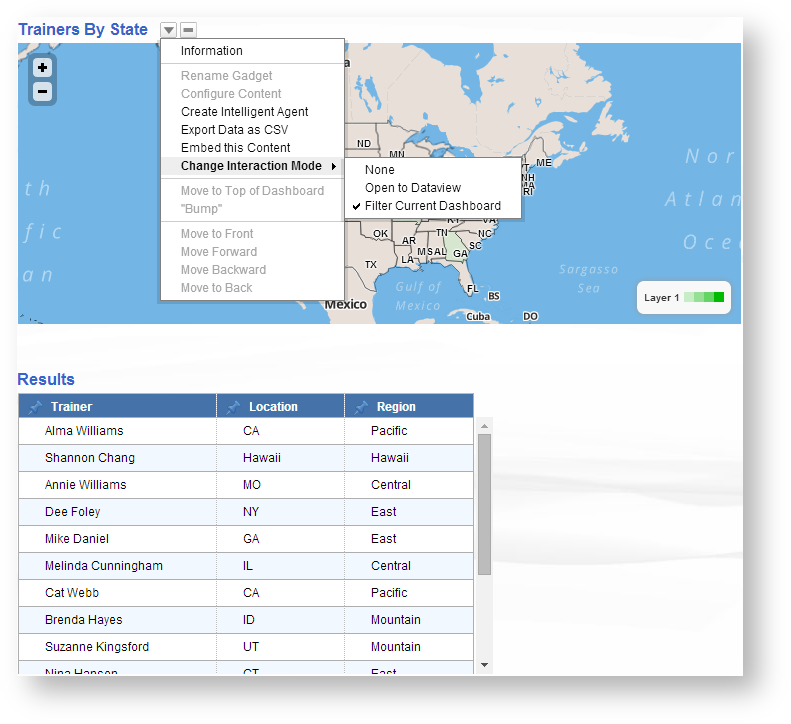 Image Added Image Added
Once selected, the user can now click an element on the above map to filter the results of other tables and charts. For example I will select California on the above map 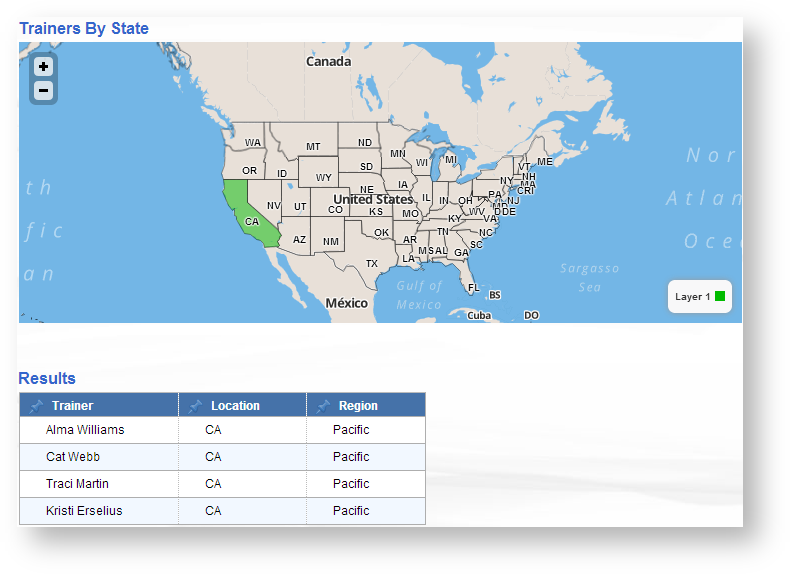 Image Added Image Added
As we can see the below table is only showing data associated to California. The user can then click the element again to toggle back to a full view. |