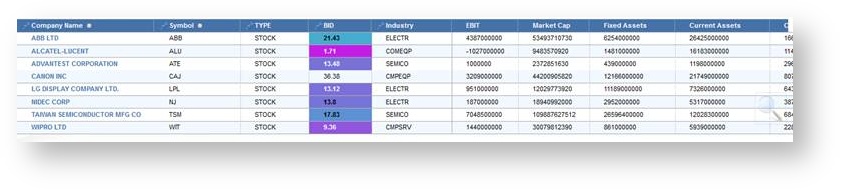
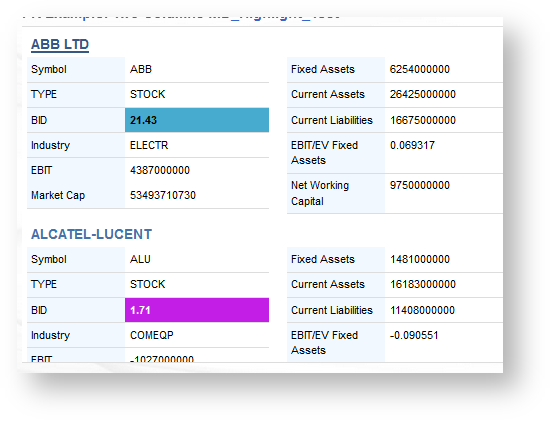
Child pages
  • January 23rd, 2015 Release Notes

Versions Compared

Key

  • This line was added.
  • This line was removed.
  • Formatting was changed.
Section
Column

January 9th 23rd, 20142015

Excerpt

The iSEEK team is happy to announce recent enhancements based on user feedback.  This release we focused on implementing new chart types and Improvements.   We think you’ll love the new:

  • Trellis Charts
  • Bubble Charts
  • Highlighted Columns Improvements
  • Wrap Text
  • Overview Tables

...

Section
Column
width60px


Column

Anchor
Trellis Charting
Trellis Charting

Trellis Charting

A Trellis chart is a series of similar graphs or charts using the same scale and axes, allowing them to be easily compared. It uses multiple views to show different partitions of a dataset. Here are a few examples one could use:


  • Sales by quarter by corporate division (with total pipeline shaded behind the bar representing $)
  • Student scores by classroom (for math and reading) or student scores by semester by cohort
  • Financial data by quarter (shown below) or by sector

...

Section
Column
width60px


Column

Anchor
workboxtasks
workboxtasks

Bubble Charts

bubble chart is a type of chart that displays three dimensions of data: the x and y values control the bubbles position on the graph while the z value controls the size of the bubble. The bubble chart helps by visually showing the relationship between the three dimensions.


Section
Column
width60px


Column

Anchor
pagetasks
pagetasks

Highlighted Column Improvements

We improved highlighted columns to include more color ranges. This will help all users bring direct attention to specific data elements. There is also a weighted "Scorescore" you can place on each numeric range to be applied to the highlighted column count.


Section
Column
width60px


Column

Anchor
Wrap Text
Wrap Text

Wrap Text In Large Tables

Users will now be able to resize table columns and Wrap Textwrap text. This will enhance readability for users when creating tables and result views.


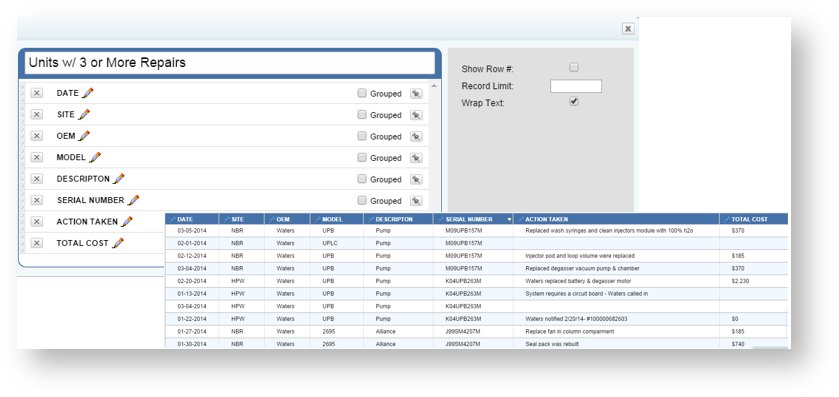
 As you can see the

Actions

actions taken field can be a little too long and with larger tables that means more scrolling. When we use the wrap text feature the same table will look like this
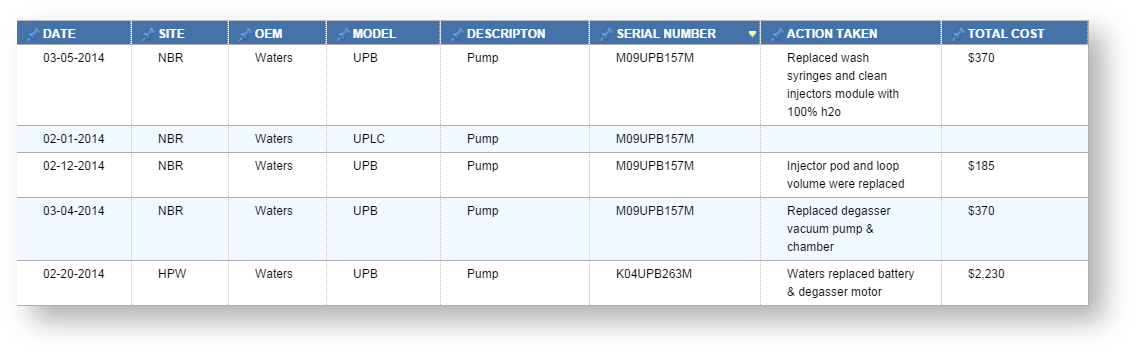
Section
Column
width60px


Column

Anchor
Overview Tables
Overview Tables

Overview Tables

The new Overview overview tables allow users to change the visual display of their data into list form. This feature is useful when looking at a specific piece of information. These tables can also be embedded into other tables view the "link" image.