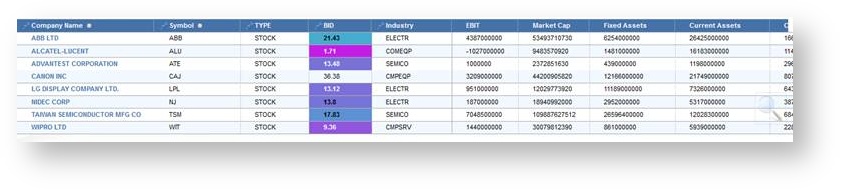
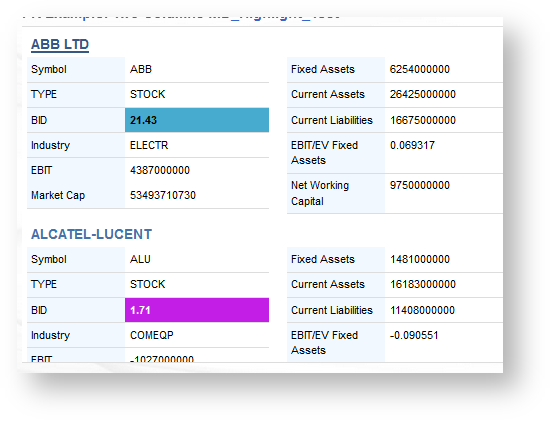
mobilemobileWrap Text In Large TablesStay productive on the go with a new, super-responsive interface optimised for iOS 5. With Confluence mobile you can: Manage your personal tasks and notifications.Browse popular content, recent blog posts and network activity.Search Confluence for content and people.Like pages, blog posts and comments.Add comments to pages and blog posts.View the profiles of your colleagues. Tap to call, SMS or email them directly from your mobile device.Users will now be able to resize table columns and wrap text. This will enhance readability for users when creating tables and result views. 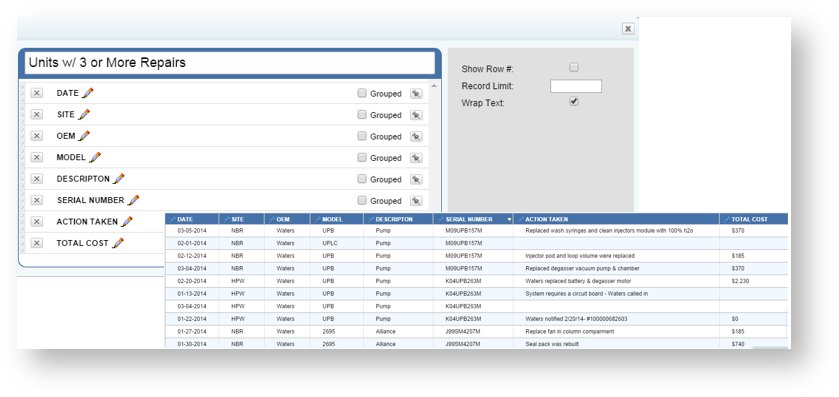 Image Added Image Added
As you can see the actions taken field can be a little too long and with larger tables that means more scrolling. When we use the wrap text feature the same table will look like this 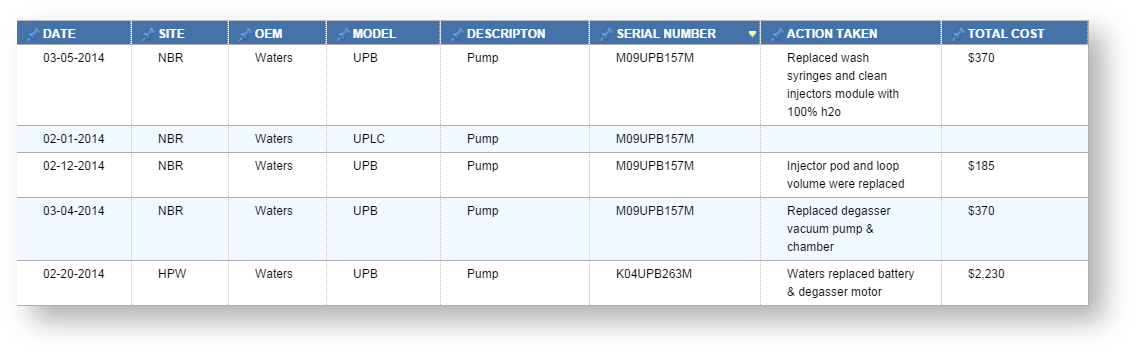 Image Added Image Added
|